SEO project
Khadi Organique: SEO results
1.19M impressions on Google search. Google Search Console, last 6 months (to September 2026).
- 1.19M
- impressions on Google search
- 10.3K
- clicks from Google search
- 9.5
- average position
- 59.4K
- impressions in Google's AI answers
The project
What the numbers say
In the last six months, Khadi Organique was shown 1.19M times on Google search and clicked 10.3K times, at an average position of 9.5. It also appeared 59.4K times in Google's AI answers, the most of any project on this page.
- Client
- Khadi Organique
- What we did
- SEO
- Sources
- Google Analytics and Search Console
- Measured
- Last 6 months
Where the figures come from
- Google Search Console: clicks and impressionsLast 6 months
- Google Search Console: appearances in AI answersLast 6 months
- Google Analytics: visitors1 Mar to 31 Jul 2026
Every figure on this page is read from a screenshot of the client’s own Google account, shown below in full.
The evidence
Each screenshot, and what it shows
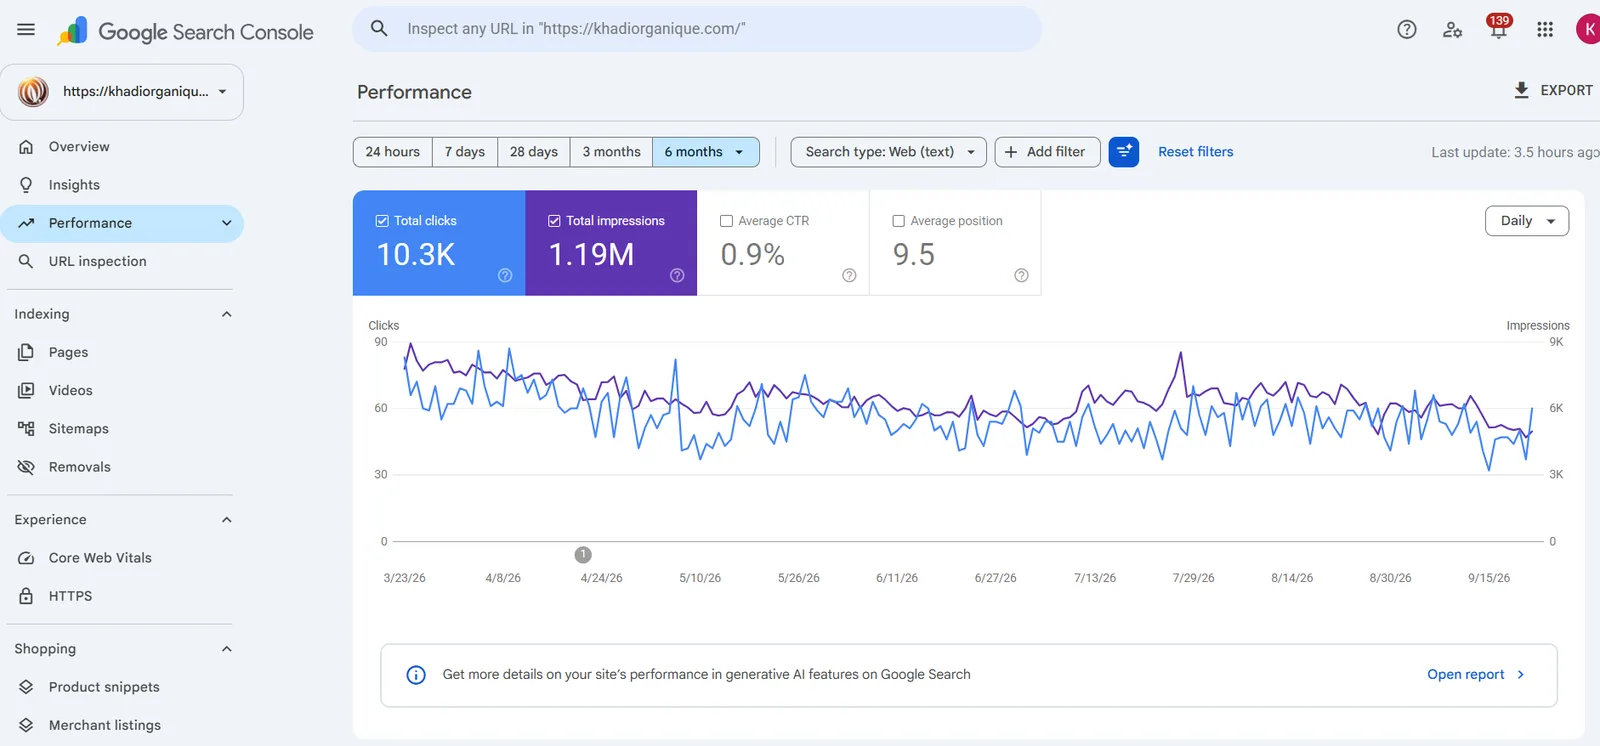
Google Search Console: clicks and impressions
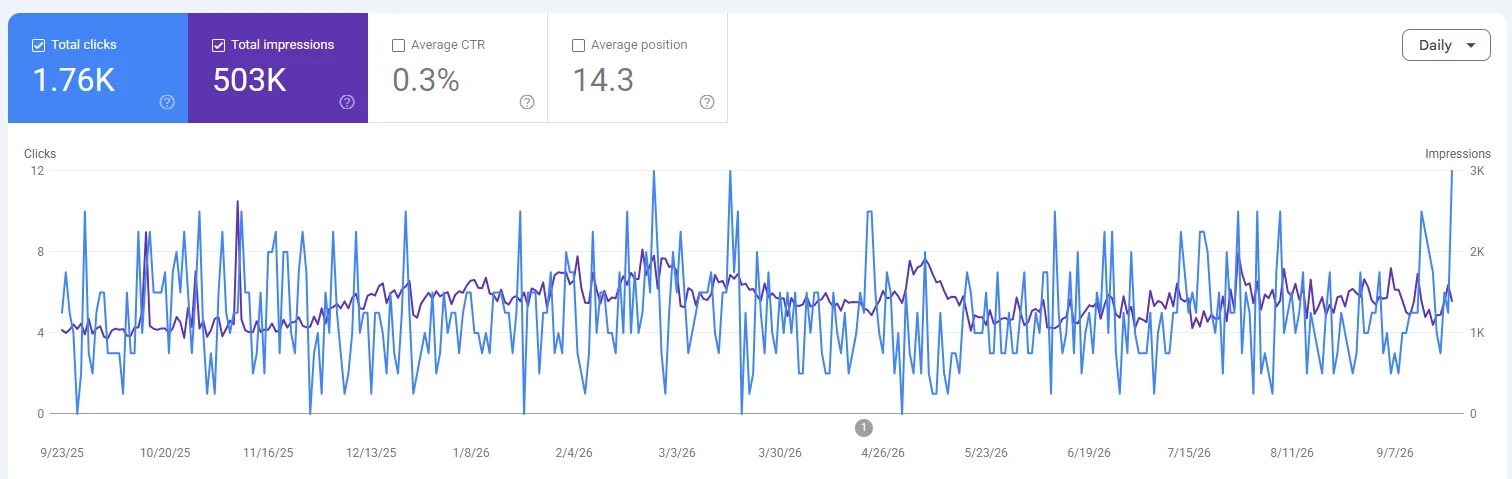
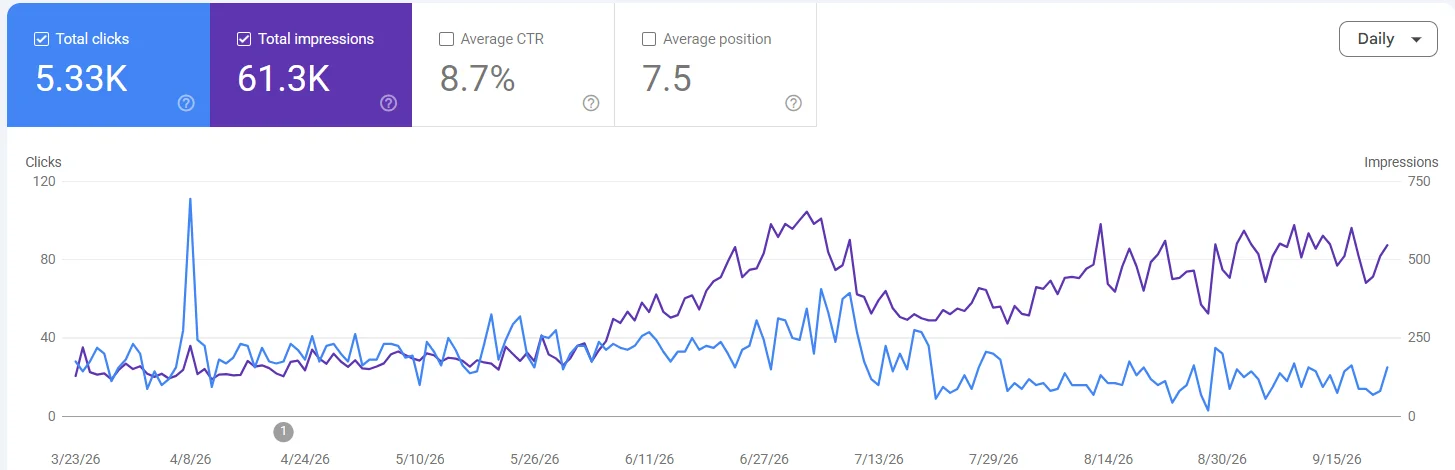
Search Console is Google's own record of the site in search: how often it was shown, how often it was clicked and where it ranked on average. The two lines on the chart are clicks and impressions, day by day.
Last 6 months
- 10.3K
- clicks
- 1.19M
- impressions
- 0.9%
- average click rate
- 9.5
- average position
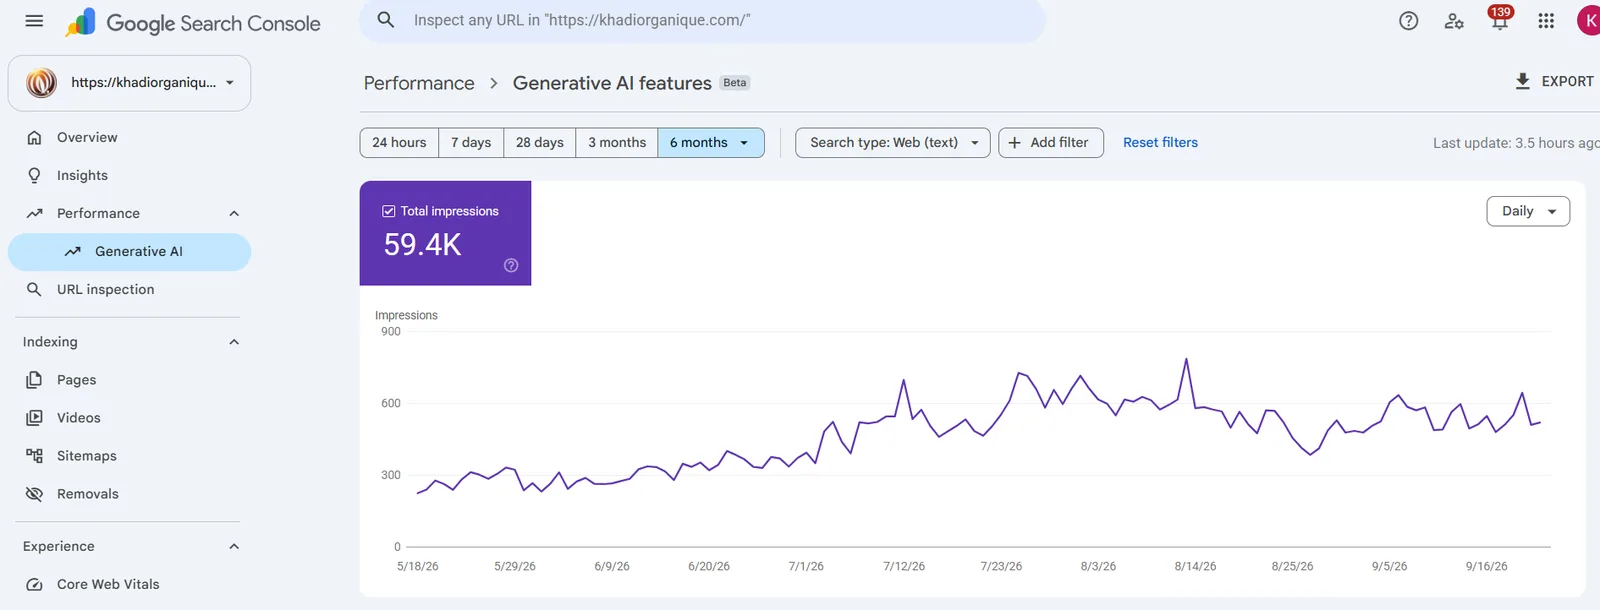
Google Search Console: appearances in AI answers
This Search Console report counts how often the site appeared inside Google's AI-written answers, the summaries now shown above the usual results.
Last 6 months
- 59.4K
- impressions in AI answers
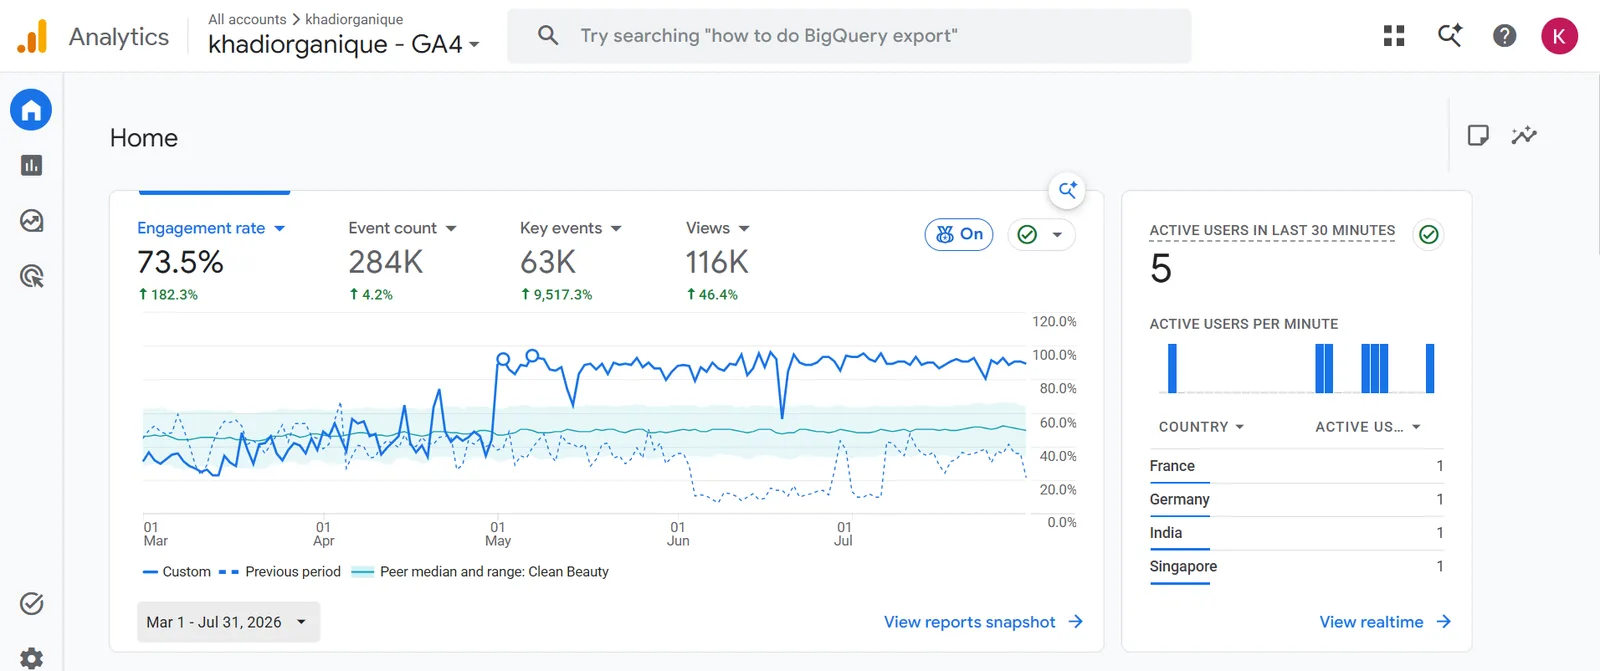
Google Analytics: visitors
Google Analytics counts everyone who visits the site, whether they came from search or from anywhere else. The green percentages on the screenshot compare this period with the one before it.
1 Mar to 31 Jul 2026
- 73.5%
- engagement rate (+182.3%)
- 284K
- events
- 63K
- key events (+9,517.3%)
- 116K
- views (+46.4%)
How to read these figures
Six terms, in plain words
- Active users
- People who visited the site and did something on it, counted by Google Analytics. It includes visitors from every source.
- Impressions
- How many times a page of the site was shown to someone in Google's results.
- Clicks
- How many times someone chose the site from those results and opened it.
- Average click rate
- Clicks divided by impressions: of every 100 times the site was shown, how many led to a visit.
- Average position
- Where the site ranked on average across all the searches it appeared for. 1 is the top result; 10 is usually the end of the first page.
- AI answers
- Appearances in the AI-written summaries Google shows above the normal results.
Want something like this?
Tell us what you need. We reply within 2 working hours (IST) and send a written proposal within 48 hours of our call.